
Understanding how to calculate TAM, SAM, SOM is essential for companies making high-impact decisions around growth, investment, pricing, and market expansion. These metrics appear in nearly every strategic plan and investor deck, yet they are still among the most misunderstood and misused concepts in business strategy.
When calculated with rigor, TAM, SAM, SOM help leadership teams understand whether growth is structurally possible and under what conditions it can realistically happen. When calculated poorly, they create a false sense of scale that collapses as soon as execution begins.
This article explains how to calculate TAM, SAM, SOM correctly, why methodology matters more than the final number, and how to avoid the most common mistakes that lead companies to scale based on fragile assumptions.
What TAM, SAM, SOM Actually Mean
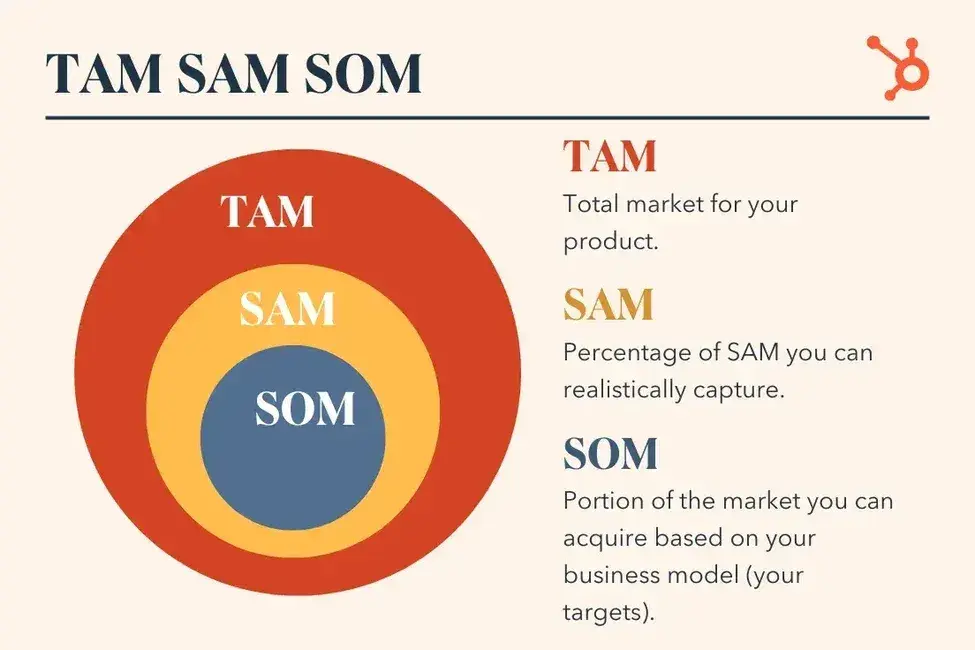
TAM, or Total Addressable Market, represents the total market demand for a product or service if a company were to capture 100 percent of all potential customers. SAM, the Serviceable Available Market, narrows that view to the portion of the market the company can serve with its current product, business model, and geographic reach. SOM, the Serviceable Obtainable Market, represents the share of that market the company can realistically capture given competition, execution capacity, and commercial constraints.
These definitions are widely accepted and used by investors, consultants, and operators. A clear reference can be found on Investopedia, which provides a formal definition of TAM and related concepts:
https://www.investopedia.com/terms/t/tam.asp
What is often overlooked is that TAM, SAM, SOM are not static facts. They are structured hypotheses about customer behavior, willingness to pay, distribution, and execution.
Why TAM, SAM, SOM Matter in Practice
These metrics are not designed to prove that a market is large. They exist to reduce risk in decisions that are expensive and difficult to reverse.
They become critical when a company is considering entering a new market, scaling a sales organization, redefining pricing, committing capital, or supporting investment, M&A, or valuation discussions. In B2B and SaaS companies, weak market sizing logic often leads to inflated revenue forecasts, premature hiring, misaligned go-to-market strategies, and capital allocation mistakes.
Well-built TAM, SAM, SOM models force leadership teams to confront execution reality early, rather than discovering structural limitations after scale has already begun.
How to Calculate TAM and Why Methodology Matters
There are two primary approaches to calculating TAM: top-down and bottom-up. Both are valid in theory, but they serve very different purposes.
The top-down approach starts with broad market data and progressively narrows it using filters. A typical example begins with the global software market, then limits it to SaaS, then B2B, and finally to a specific industry or segment. This approach can be useful for macro context, especially when credible data exists at each layer.
The problem is that top-down TAMs often rely on generic reports and arbitrary assumptions. When filters are not grounded in real buying behavior, the resulting number looks impressive but offers little guidance for execution. This is why many investors treat top-down TAMs with skepticism.
A more reliable approach is bottom-up market sizing. This method starts from the unit economics of the business rather than from aggregated market reports.
In a bottom-up model, TAM is calculated by multiplying the number of potential customers that truly fit the ideal customer profile by the realistic annual revenue per customer. For example, if a SaaS company identifies twenty thousand companies that match its ICP and charges an average annual contract value of twelve thousand euros, the resulting TAM is two hundred and forty million euros.
This approach forces the company to answer uncomfortable but essential questions. Who actually buys the product. What they pay. How often they renew. Under what conditions they churn. While the resulting number may be smaller, it is far more useful for strategic decision-making.
For a broader discussion on why aggregated financial logic often breaks down when applied to real decisions, see this Harvard Business Review analysis:
https://hbr.org/2014/04/a-refresher-on-net-present-value

The Most Common Mistake When Defining SAM
One of the most frequent errors in market sizing is treating SAM as a purely geographic subset of TAM. A common statement is that TAM is global while SAM is limited to specific regions such as Europe and the United States.
In practice, SAM is not defined only by where a company can sell, but by where its product actually works. Market maturity, regulatory complexity, buying behavior, sales cycles, pricing tolerance, and competitive dynamics all influence whether a market is serviceable in reality.
A product can have the same TAM in two countries and radically different SAMs. Ignoring this distinction leads companies to overestimate near-term opportunity and underestimate execution friction.
Research and insights on how market dynamics affect growth strategies are regularly published by McKinsey, particularly in their work on market entry and growth:
https://www.mckinsey.com/capabilities/growth-marketing-and-sales/our-insights
Why SOM Is Where Most Market Sizing Models Break
SOM is often presented as a simple percentage of SAM, chosen because it appears reasonable or aligns with a growth narrative. Capturing one or three percent of the market over a few years is a common assumption.
In reality, SOM should be grounded in operational constraints. A credible SOM requires understanding how many salespeople can realistically be hired and ramped, what conversion rates look like across the pipeline, how long deals take to close in each segment, and where opportunities are currently stalling.
When SOM is disconnected from real pipeline data and commercial capacity, it stops being an estimate and becomes a story. This is one of the reasons why boards and investors frequently challenge SOM assumptions during due diligence.
CB Insights has documented how unrealistic assumptions around market opportunity and execution contribute to startup failures:
https://www.cbinsights.com/research/startup-failure-reasons-top/
TAM, SAM, SOM as Testable Hypotheses
The most important mindset shift is recognizing that TAM, SAM, SOM are not final numbers. They are hypotheses.
Each layer embeds assumptions about customer demand, willingness to pay, competitive differentiation, sales efficiency, and organizational capacity. When these assumptions are not made explicit, the model may appear robust. When tested against real data, many models collapse.
Strong teams use market sizing frameworks to surface uncertainty early, not to hide it behind large numbers.
Conclusion: Discipline Matters More Than Big Markets
Calculating TAM, SAM, SOM is not an exercise in optimism. It is an exercise in strategic discipline.
Companies that grow sustainably use these metrics to constrain risk, align execution with reality, and support hard decisions with evidence. The value of the model lies less in the final number and more in the rigor of the thinking behind it.
If your TAM fits neatly on a slide but cannot withstand basic operational questions, the issue is not the market. It is the model.
Frequently Asked Questions About TAM, SAM, SOM
What is the difference between TAM, SAM, SOM?
TAM represents total market demand, SAM narrows this to the portion of the market a company can serve, and SOM reflects the share that can realistically be captured given execution and competition.
How accurate do TAM, SAM, SOM need to be?
They do not need to be precise forecasts, but they must be internally consistent and grounded in realistic assumptions about pricing, demand, and sales capacity.
Is bottom-up market sizing better than top-down?
Bottom-up approaches are generally more reliable for operational decisions, while top-down models are better suited for high-level context.
Why do investors challenge TAM, SAM, SOM?
Because inflated or poorly justified market sizing often hides execution risk and leads to unrealistic growth expectations.
How often should TAM, SAM, SOM be updated?
They should be revisited whenever pricing, target segments, sales models, or geographic focus change.