
Win rate is one of those metrics where the number means nothing without context. A 25% win rate is excellent for enterprise software and concerning for SMB transactional sales. A 40% win rate can signal a thriving commercial operation or a team that is systematically avoiding difficult opportunities. The benchmark only becomes useful when you compare it against the right denominator.
This article compiles the most credible win rate data available in 2026, segmented by deal size, company stage, sales channel, funnel stage, and industry vertical. Every number here comes from named research with a sample size large enough to be meaningful.
The Denominator Problem: Why Most Win Rate Comparisons Are Meaningless
Before looking at any benchmark, you need to resolve the denominator question. The most cited benchmark is 21% from HubSpot’s Sales Trends Report. Another credible study puts it at 47%. Both are correct. The difference is not the data but the denominator. prospeo
Win rate calculated against all opportunities entered into a CRM will always be lower than win rate calculated against opportunities that reached the proposal or late stage. Neither is wrong. They measure different things. The 21% figure typically reflects all pipeline entries. The 47% figure typically reflects post-proposal conversion. Knowing which definition your team uses is the prerequisite for any meaningful benchmark comparison.
The average B2B win rate is 21% across all opportunities and 29% for qualified-only opportunities. That 8-point gap represents deals that should never have entered the pipeline. If your win rate is low, the first diagnostic question is not “are our salespeople underperforming?” It is “what is our pipeline entry standard, and are we enforcing it?” Landbase
Win Rate Benchmarks by Deal Size (ACV)
Deal size is the single most predictive variable in win rate variance. An Optifai benchmark study across 939 B2B SaaS companies breaks it down clearly by ACV range, with 25th percentile, median, and 75th percentile figures: under $10K ACV shows 28%, 31%, and 35% respectively; $10K to $50K shows 20%, 24%, and 28%; $50K to $100K shows 15%, 18%, and 22%; and over $100K shows 12%, 15%, and 18%. prospeo
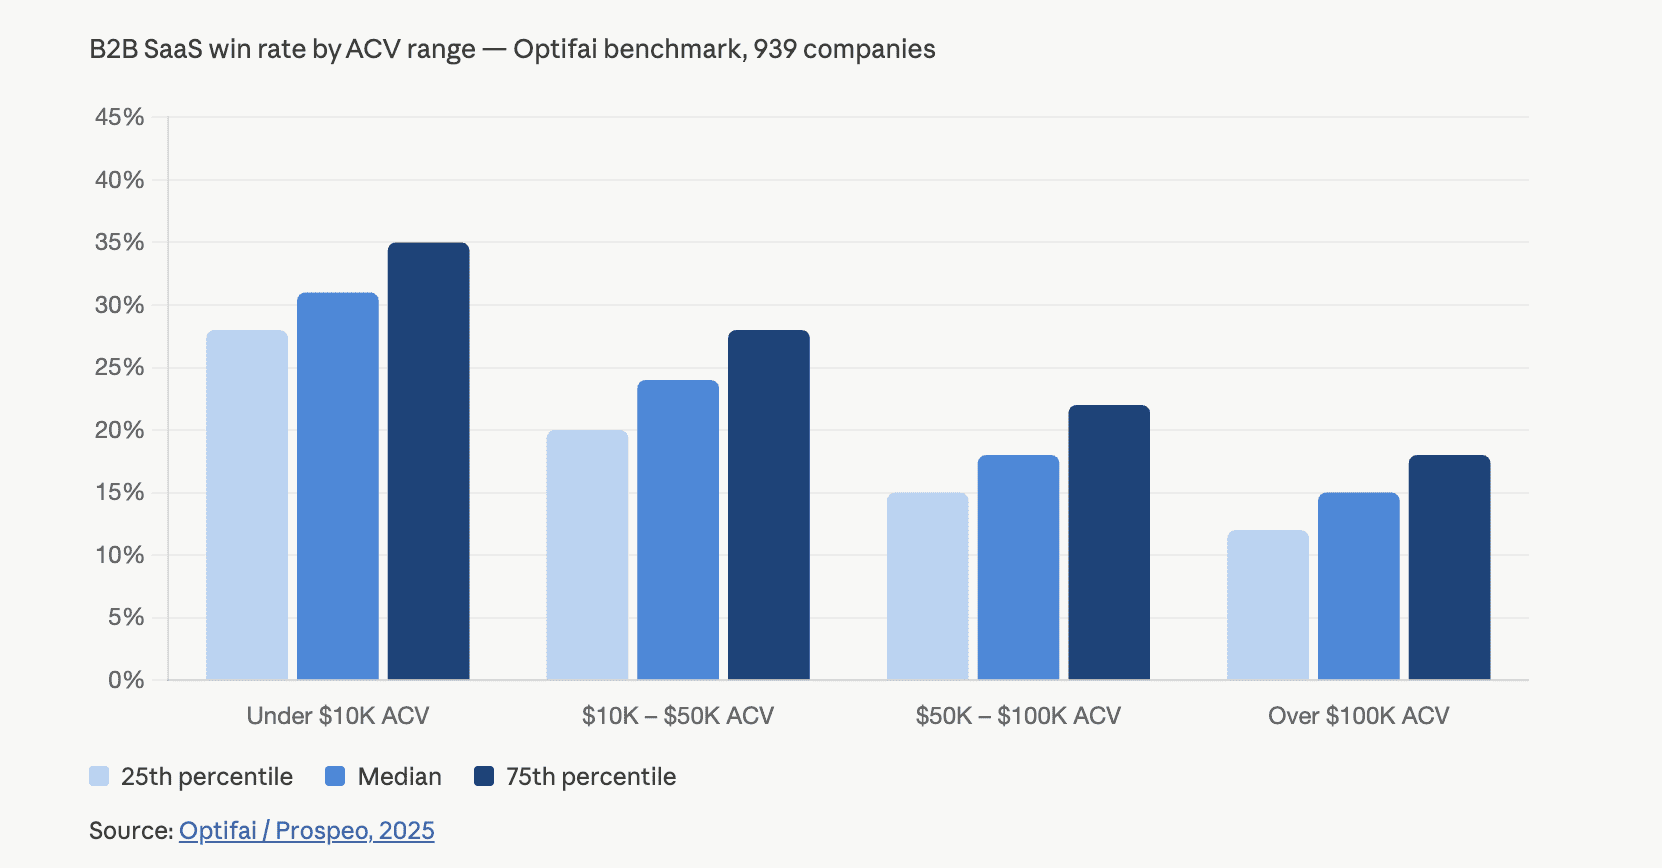
The pattern is consistent and logical. Larger deals involve more stakeholders, averaging 13 decision-makers per enterprise deal in 2026, longer procurement cycles, and higher competitive intensity. Each additional stakeholder is an additional point of failure in the sales process. Landbase
The strategic implication of this data is often missed. Enterprise generates similar revenue to SMB with 93% fewer opportunities to manage. Factor in CAC, lifetime value, and support costs and enterprise often has 3 to 5 times better unit economics despite the lower win rate. A lower win rate at higher ACV is not necessarily a problem. It is the expected economics of the motion. Optifai
Win Rate Benchmarks by Company Stage
Enterprise firms close at 31% opportunity-to-close versus 39% for SMBs. The gap reflects not just deal complexity but also the relative sophistication of the sales process. Larger companies tend to sell to larger buyers with more rigorous procurement processes, naturally compressing conversion. The Digital Bloom
For growth-stage SaaS companies specifically, the trajectory matters as much as the point-in-time number. The 2025 Ebsta x Pavilion report shows win rates declining to 19%, down from 29% in 2024, a significant drop year over year. Win rates in the 17 to 20% range were already being flagged as a concern in 2023 by Winning by Design. This is a market-wide compression, not a company-specific problem, and it is driven primarily by longer buying cycles, more cautious buyers, and increased competition. Gradient
75% of B2B buyers say they are taking longer to make purchase decisions than they did in 2023, and 78% say they are more careful with spending than before, according to Salesforce’s State of Sales 2024. Win rate benchmarks from 2021 and 2022 should be treated as historical context, not current targets. Gradient
Win Rate by Sales Channel and Lead Source
Where an opportunity originates predicts its conversion rate more reliably than almost any other variable. Website-generated leads convert at 31.3% from MQL to SQL, more than twice the overall average, demonstrating the power of inbound intent signals. Customer and employee referrals achieve 24.7% conversion. Webinars convert at 17.8%. Events generate only 4.2% MQL-to-SQL conversion despite creating opportunities for relationship building. Lead lists convert at just 2.5%, and email campaigns achieve only 0.9%, highlighting the weakness of outbound approaches that lack genuine buyer intent. The Digital Bloom
The most striking channel data comes from relationship-based sourcing. According to Champify’s 2025 Impact Report, selling to known contacts (former customers, past champions who changed jobs) delivers a 37% win rate compared to 19% for cold outreach. That is nearly a 2x improvement from relationship leverage alone. Salesmotion
According to Ebsta’s 2024 B2B Sales Benchmark Report, partner-sourced opportunities boast the highest win rates across all GTM motions. Revenue attribution to partners has grown substantially, with 26 to 28% of revenue now coming through partners in 2025, up from 18 to 20% in 2024. The Digital Bloom
The practical implication is direct: if your pipeline mix is heavily weighted toward cold outbound, your blended win rate will structurally underperform a team with equivalent skill but stronger inbound and relationship-sourced pipeline. Win rate improvement starts at the top of the funnel, not at the close.
Win Rate by Funnel Stage
Understanding win rate at the aggregate level is useful. Understanding it by stage is where the diagnostic value lives. SQL-to-close conversion averages 20 to 25% across B2B SaaS, and top performers exceed 30%. Demo-to-opportunity conversion rates range from 60 to 80% for average performers, while elite teams exceed 90%. SaaS Hero
The MQL-to-SQL transition is the biggest bottleneck in the typical SaaS funnel, with average conversion of 15 to 21%. Improving this stage by 5 percentage points can lift revenue by up to 18%. This is the stage where marketing and sales alignment (or misalignment) becomes financially visible. The Digital Bloom
Deal timing within the funnel also matters dramatically. Delayed deals reduce win rates by 113%. Early decision-maker involvement, by contrast, boosts win rates by 55%, according to Ebsta x Pavilion 2025. Deals closed within 50 days hit a 47% win rate, while deals dragging past that threshold drop to approximately 20%. Velocity is not just a pipeline health metric. It is a win rate driver. Gradientprospeo
What Separates Top Performers From the Rest
Just 14% of sellers now drive 80% of revenue, an 11x performance difference between top and bottom quartile, according to Ebsta x Pavilion’s 2025 GTM Benchmarks. The gap between top and bottom performers has widened, not closed, as the market has become more difficult. Gradient
The research is consistent on what top performers do differently.
Multi-threading buying committees. Engaging three or more contacts per deal produces 2.4 times higher close rates, rising to 3.1 times for enterprise deals. With buying committees averaging 13 people, single-threaded deals are increasingly fragile. One champion departure or budget reassignment can kill a deal that had no backup relationships. Salesmotion
Qualification discipline. Fully documented qualification criteria using frameworks like MEDDIC or MEDDPICC correlate with 40% higher close rates. The discipline is not the framework itself but the consistency with which deals are evaluated against real criteria rather than rep optimism. Salesmotion
Speed to response. Responding to inbound interest within 5 minutes correlates with 21% higher win rates. After 24 hours, rates drop roughly 60%. This is one of the most consistently supported findings across multiple independent studies and one of the most consistently ignored in practice. Salesmotion
Pipeline entry standards. Teams using AI qualification report 50% better ICP accuracy, which directly lifts win rates by ensuring reps only work accounts that genuinely fit. The fastest path to a higher win rate is usually not training the sales team. It is tightening what enters the pipeline in the first place. Landbase
How to Use These Benchmarks Without Getting Misled
Win rate benchmarks are useful for orientation and deeply dangerous as absolute targets. Three common mistakes are worth naming.
Comparing against the wrong universe is the most common. A vertical SaaS company selling $80K contracts to healthcare systems should not benchmark against a PLG company closing $3K contracts to startups. Both are B2B SaaS. Their win rate dynamics have almost nothing in common.
Ignoring the definition mismatch. Before comparing your win rate to any external benchmark, confirm what the study counted in its denominator and what stage of the funnel it measured. A 10-point gap that looks alarming often disappears when the definitions are aligned.
Optimizing win rate as an end in itself. Win rates above 40% may signal that your team is under-qualifying or only pursuing safe deals. High win rates can actually signal missed revenue if reps avoid stretch opportunities. The goal is not the highest possible win rate. It is the optimal combination of win rate, deal size, and pipeline volume that produces the revenue target at acceptable cost. Salesmotion
The most useful application of win rate benchmarks is internal trend analysis. Is your win rate moving in the right direction over time? Is it consistent across reps, segments, and channels, or are there structural disparities worth investigating? Those questions require your own longitudinal data more than they require external benchmarks.
Zenit Data works with B2B SaaS and services companies to build the revenue analytics infrastructure that makes this kind of analysis possible: clean pipeline data, consistent stage definitions, and win/loss tracking that actually captures why deals are won and lost rather than just whether they were.
FAQ
What is a good win rate for B2B SaaS in 2026?
For mid-market SaaS deals between $10K and $50K ACV, a median win rate of 24% is typical, with top performers reaching 28% or above, based on Optifai’s benchmark of 939 B2B SaaS companies. For enterprise deals above $100K, 15 to 18% is the median range. Healthy win rates also depend heavily on how you define the denominator: all pipeline entries versus qualified opportunities only.
Why have B2B win rates declined in recent years?
The Ebsta x Pavilion 2025 GTM Benchmarks show win rates declining to 19%, down from 29% in 2024. The primary drivers are longer buying cycles, more cautious procurement, larger buying committees, and increased competition across most SaaS categories. This is a market-wide compression, not a company-specific problem for most teams experiencing it.
What lead source produces the highest win rate?
Deals sourced from known contacts (former customers, past champions who changed companies) produce a 37% win rate versus 19% for cold outbound, according to Champify’s 2025 Impact Report. Partner-sourced opportunities and inbound intent-based leads also consistently outperform cold outreach across multiple studies.
How does deal size affect win rate?
Win rate decreases as deal size increases across every study that has examined this relationship. Under $10K ACV, median win rates run around 31%. Over $100K ACV, the median drops to 15%. This reflects the growing number of stakeholders, longer procurement cycles, and higher competitive intensity at larger deal sizes.
What is the difference between win rate and close rate?
Win rate is typically calculated as won deals divided by all decided deals (won plus lost), excluding open opportunities. Close rate is sometimes used interchangeably but can also refer to the conversion rate at a specific funnel stage, such as SQL to close. The terms are used inconsistently across tools and reports, which is why confirming definitions before benchmarking is essential.
How can I improve my B2B SaaS win rate?
The four highest-impact levers identified consistently across research are: tightening pipeline entry standards to exclude deals with poor ICP fit, multi-threading buying committees to engage three or more contacts per deal, responding to inbound interest within five minutes, and applying structured qualification frameworks like MEDDIC consistently. Improving pipeline quality at entry typically produces faster results than improving sales skills at close.
Zenit Data helps B2B SaaS and services companies build the revenue analytics infrastructure to track win rates by segment, channel and stage, and to diagnose what is actually driving performance. Explore our revenue analytics solutions.