
I have seen many B2B teams treat market size as a slide for investors instead of a working tool for decisions. That is usually where the trouble starts. A weak estimate can push a company into the wrong segment, a bad territory plan, or a sales motion that looks good in theory and fails in practice.
A sound market sizing approach turns strategy from opinion into a model that can be tested.
In my experience, this matters even more in B2B and SaaS than in many other sectors. Sales cycles are long. Average contract values vary a lot. Product scope changes fast. One small assumption about pricing, account count, or penetration can distort the whole picture. I have worked on cases where a leadership team thought it had a billion-euro opportunity, but once I segmented the market by geography, firm size, and product fit, the reachable revenue pool became far smaller and far more useful.
That is why I like to frame market estimation as a method, not a one-off number. It should guide where a team sells, what it builds, how it hires, and how it speaks to investors. At ZenitData, this is often the bridge between external market intelligence and internal revenue planning. The best teams do not ask only, “How big is the market?” They ask, “Which slice can we reach, with what motion, and at what return?”
Why market size matters for B2B, SaaS, and investors
When I work with founders, CROs, or strategy leaders, I usually see three reasons they care about this process. First, they need a realistic growth story. Second, they need to decide where to place scarce resources. Third, they need to test whether a market story matches actual buying behavior.
Market size is not just a finance metric. It is a go-to-market filter.
For a B2B SaaS company, the addressable market shapes territory design, account scoring, partner strategy, and pricing. If the ideal customer profile is too narrow, expansion can stall even with strong win rates. If the target market is too broad, pipeline gets filled with poor-fit accounts and forecast quality drops.
I remember a software team that wanted to enter mid-market manufacturing across Europe. On paper, the segment looked attractive. But when I broke down the market by ERP stack, digital maturity, language coverage, and sales capacity, only a fraction was reachable in the next 24 months. That changed hiring plans and reduced wasted spend. Short sentence. It saved time.
For investors, the same exercise serves a different purpose. A private equity or venture team may want to know whether a category has enough headroom, whether a platform company can expand into adjacent segments, or whether commercial due diligence assumptions hold up. A strong sizing model also helps test whether growth came from market momentum or from true share gains.
Bad market numbers create bad bets.
If you want a deeper view of how intelligence supports strategic choices in SaaS, I suggest reading market intelligence strategy for B2B SaaS companies. I find that market sizing works best when it sits inside a broader decision framework rather than as an isolated spreadsheet.
What a market sizing method actually means
People often use the phrase loosely. I do not. When I say market sizing method, I mean the full logic used to estimate the revenue or volume potential of a defined market, using explicit assumptions, segment boundaries, and data sources.
A market sizing method is the structured way I estimate how much demand exists, for whom, and under which conditions.
That includes five linked parts:
-
Defining the market and product scope.
-
Choosing a segmentation model.
-
Selecting top-down, bottom-up, or hybrid estimation logic.
-
Validating assumptions with data and expert checks.
-
Translating the result into decision-ready outputs.
I stress “defined market” because vague categories lead to vague numbers. If I size “sales software,” I may get a large figure that means little. If I size “revenue intelligence software for B2B SaaS companies with 50 to 500 employees in Western Europe using a direct sales motion,” the number gets smaller, but it becomes useful.
The tighter the definition, the better the decision value.
That discipline also helps revenue teams. A market model should align with CRM fields, territory rules, account lists, and pricing logic. Otherwise, strategy and execution drift apart.
Top-down and bottom-up methods
I see teams argue about which method is better. In practice, I rarely pick just one. I compare them, then reconcile the gaps.
How top-down sizing works
Top-down sizing starts with a broad market figure from external data, then narrows it using filters. For example, I might start with total software spend in a region, isolate a category, apply the share for B2B buyers, then narrow to company sizes and countries that match the target profile.
Top-down sizing is fast and useful for understanding the outer boundary of a market.
It works well when I need an early directional estimate, especially for fundraising, new category scans, or international expansion screens. It is also helpful when direct account-level data is limited.
But there are limits. Broad category reports can be too general for a specific product. Definitions may differ. Time periods may not match. And category growth rates can hide major variation between subsegments.
For macro data, I often cross-check figures from sources such as OECD, Eurostat, the U.S. Census Bureau, and company filings. These sources do not hand me the final answer, but they give a stable starting frame.
How bottom-up sizing works
Bottom-up sizing starts from units I can count and monetize. In SaaS, that usually means target accounts multiplied by likely seat count, usage level, or annual contract value. If I know there are 8,000 target firms in a region, 20 percent fit my ICP well, average annual value is 18,000 euros, and realistic penetration over a period is 5 percent, I can estimate a reachable revenue pool with more precision.
Bottom-up sizing is more grounded because it starts with real buyers, real pricing, and real sales constraints.
This is the method I trust most for go-to-market planning. It is especially useful for territory planning, pipeline targets, and capacity modeling. Revenue leaders can map named accounts, sales cycles, conversion rates, and rep coverage directly into the model.
I often use account databases, CRM history, billing data, and intent or firmographic datasets for this work. In some projects, I also create proxies when direct data does not exist. For example, I may estimate likely demand using employee count in a specific function, cloud adoption signals, or installed software stack.
Why I often combine both
In real projects, I usually start broad with top-down logic, then pressure-test with bottom-up calculations. If the two views differ too much, that is a signal to inspect assumptions, not to pick the bigger number.
The best sizing models are triangulated, not guessed.
This is one reason ZenitData’s style of work fits strategy teams well. A leadership team may need category context, but also a model tied to pipeline reality. That requires both external intelligence and internal revenue logic.

TAM, SAM, and SOM in practice
Most teams know the acronyms, but I often find that they are used too loosely. I prefer plain definitions tied to decisions.
TAM is the total revenue opportunity if every possible buyer who fits the broad use case bought a relevant solution.
SAM is the share of that market I can serve based on product scope, geography, compliance, language, and sales reach.
SOM is the share I can realistically win in a defined time frame with my current or planned capabilities.
That last point matters. SOM should not be a hopeful fraction of TAM. It should come from actual go-to-market mechanics. How many accounts can the team cover? What is the win rate? How fast can implementation scale? Which channels exist? What is the sales cycle?
I have seen founders build huge TAM slides, then fail to explain how the company would reach even 1 percent of a much smaller served market. Investors notice that gap fast. So do boards.
For a clean breakdown, I often point people to this explanation of TAM, SAM, and SOM. It helps keep the three layers distinct.
In pipeline planning, these frameworks do more than support storytelling. If SAM is concentrated in 2,000 high-fit accounts and the team can actively work 400 per quarter, that changes SDR hiring, territory design, and partner choices. If SOM is thin in the home market, expansion or product bundling may become the better path.
TAM tells the story. SAM sets the focus. SOM shapes the plan.
How I structure a market sizing project
I like to keep the process simple, but not simplistic. Most projects I run follow the same sequence because it reduces confusion and makes assumption checks easier later.
1. Define the decision first
I start by asking what decision the model needs to support. Enter a new country? Raise capital? Recut territories? Assess a vertical? The answer changes the level of detail and the type of output.
If the decision is vague, the model will be vague too.
A fundraising model may focus on category growth and long-range expansion logic. A CRO model will need account counts, ACV bands, channel mix, and conversion assumptions.
2. Set market boundaries
Then I define product scope, geography, customer type, and period. I also decide whether the model measures annual revenue, cumulative value, users, or accounts. This step sounds basic, but I have seen many errors start here.
For example, if a SaaS platform serves both finance and revenue teams, I need to decide whether I size the market by department use case, by whole-company contract value, or by phased land-and-expand motion.
3. Build the segmentation logic
Segmentation is where market sizing becomes useful. Depending on the case, I may split by:
-
Industry or vertical.
-
Company size by employee or revenue band.
-
Region or country.
-
Digital maturity or installed systems.
-
Buying center or function.
-
Pricing tier or expected contract value.
I prefer segments that link to action. If a segment cannot be targeted, priced, or staffed differently, it may not belong in the model.
4. Choose data sources and proxies
At this stage, I collect direct data where possible and proxy data where needed. Direct sources can include government statistics, association reports, company financial statements, CRM records, product analytics, billing data, and customer interviews. Proxy variables may include employee counts in a specific role, cloud spend, number of sales reps, or job postings.
If you want a broader view on intelligence inputs, I find this comparison of market intelligence, market research, and business intelligence useful because these terms often get mixed up during project design.
5. Build the model and document assumptions
I always write assumptions clearly. Not in my head. In the model. Market growth, penetration, average selling price, attach rates, churn impact, implementation capacity, and conversion logic should all be visible.
An assumption that is hidden cannot be challenged, and that makes the model weak.
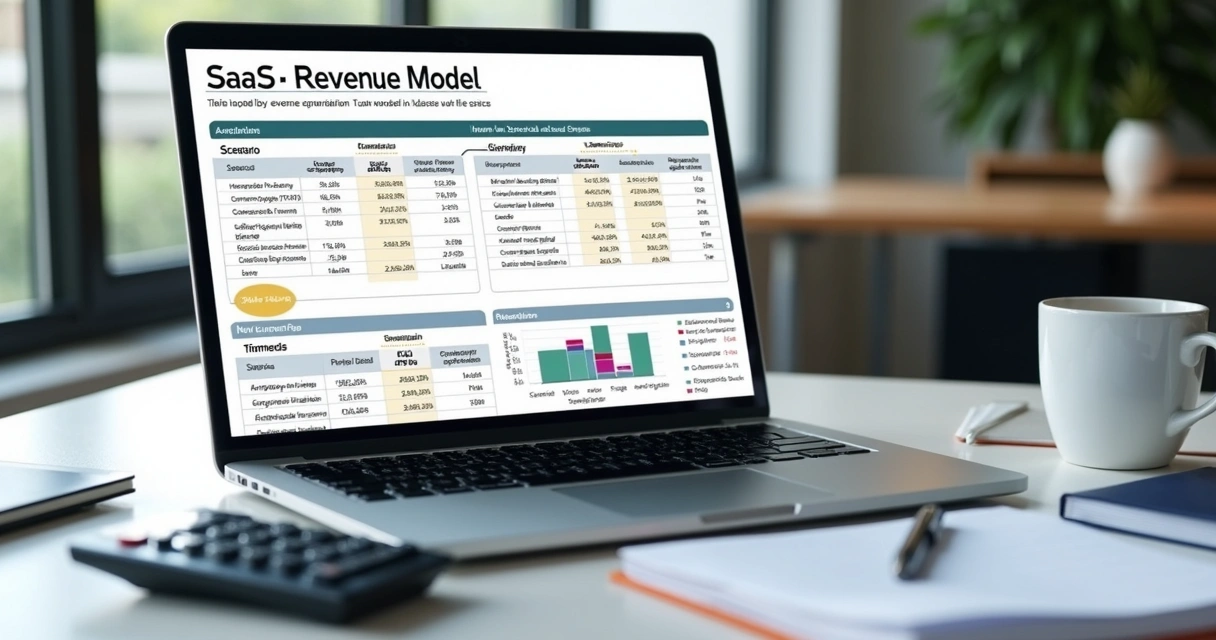
For B2B SaaS, I often build a segmented revenue model with ranges, not single-point values. That allows base, upside, and downside cases. It also supports board conversations better than one bold number that no one fully trusts.
6. Validate and reconcile
Finally, I test the output against reality. Does the account count match field experience? Does average contract value align with current sales? Does country mix fit channel coverage? Are there macro constraints that cap adoption? If top-down and bottom-up estimates are far apart, I inspect the assumptions line by line.
When companies commission deeper external work, the process often benefits from a formal intelligence brief. I have seen this make stakeholder alignment much easier, which is why I like the structure described in this guide to market intelligence reports.

Data sources and analytical techniques that work well
Not every project needs advanced modeling, but B2B and SaaS cases often benefit from a few practical techniques. I use them when the market is fragmented, pricing varies, or the buyer base is hard to observe directly.
Regression for demand estimation
If I have historical data across segments, I may use regression to estimate how factors such as company size, headcount mix, region, or tech stack relate to contract value or adoption likelihood. This helps when pricing and fit vary across customer cohorts.
Regression helps turn scattered account data into a more disciplined demand estimate.
For example, if larger sales teams and multi-country operations strongly correlate with higher contract values, I can project segment-specific revenue more accurately than by using one average ACV for everyone.
Proxy-based estimation
Some markets lack direct published data. Then I use proxies. For a RevOps tool, one proxy might be the number of companies with more than a certain count of quota-carrying reps. For a finance automation platform, I might use invoice volume, ERP adoption, or finance headcount.
Good proxies are measurable, explainable, and linked to real buying behavior.
The test is simple. If I cannot explain why a proxy relates to demand, I should not use it.
Cohort and funnel logic
For go-to-market planning, I often connect market size to funnel math. Reachable accounts become engaged accounts, then qualified pipeline, then wins, then active customers. This makes the model more realistic because it reflects actual sales motion.
It also lets revenue leaders ask better questions. If SOM looks low, is the issue market depth, poor coverage, low conversion, weak pricing, or long implementation cycles?
Scenario modeling
I rarely trust one-case forecasts. I prefer three scenarios based on changes in penetration, deal size, or speed to market. This is especially useful when raising capital or planning expansion into a new region.
Scenario models are better than point estimates because markets rarely behave in a straight line.
Actionable steps for a more accurate estimate
When I need to make a sizing model sharper, I focus on a small set of habits that improve quality fast.
-
Start with the ICP, not the category label. Define who buys, not just what the product does.
-
Break the market into segments that match pricing and sales motion.
-
Use at least two independent estimation paths and compare them.
-
Replace broad averages with segment-level assumptions where possible.
-
Check account counts manually for a sample before scaling the model.
-
Link revenue assumptions to actual conversion and retention data.
-
Document every assumption so stakeholders can test the logic.
In my work, one manual sample check can catch more model error than hours of spreadsheet work. I once reviewed a target list for a European SaaS client and found that many “qualified” accounts were actually subsidiaries, dormant entities, or outside product scope. The headline count dropped, but the model became far more useful.
If your team is focused on software categories specifically, this guide to SaaS market sizing is a good companion because SaaS models often need more attention to pricing tiers, seat logic, and expansion revenue.
Common pitfalls I see again and again
Some mistakes are technical. Others are political. Both can distort the final number.
The most common market sizing mistake is confusing possible demand with reachable demand.
That often shows up when teams treat TAM as if it were a near-term sales target. Another common issue is using market reports with category definitions that do not match the product. A broad software segment is not the same as a narrow workflow product with specific compliance and integration needs.
I also see problems when teams ignore internal data. If current win rates are weak in a segment, the model should not assume smooth entry just because the segment looks large. On the other hand, if expansion revenue is strong in one customer type, the model should account for land-and-expand economics, not just first-year ACV.
Here are a few traps I watch closely:
-
Double counting accounts across regions or subsidiaries.
-
Using one average price across very different customer groups.
-
Ignoring channel and language constraints in cross-border expansion.
-
Skipping adoption lag for products that require process change.
-
Forgetting churn, downsell, or seat contraction in recurring revenue models.
-
Letting investor storytelling override sales reality.
I think the last one deserves extra attention. Ambition has a place. Fantasy does not.
Reachable beats theoretical.
How market sizing shapes resource allocation
Good estimates do not end in a slide deck. They should show up in budgets, territories, hiring plans, and product bets.
Market sizing should tell a team where to spend time, headcount, and capital.
If one vertical has a smaller TAM but much higher fit, shorter sales cycles, and better retention, it may deserve more sales coverage than a larger but diffuse market. If one country has less total demand but stronger pricing and easier onboarding, it may be a better expansion choice than a larger, harder market.
I have seen strategy teams use sizing work to answer very practical questions. Should we open a local office? Should we hire enterprise reps or partner managers? Should product localize now or wait? Should we bundle a module to raise ACV in our best-fit segment?
At ZenitData, this is often where market intelligence and revenue analytics meet. External demand estimates can identify the pool. Internal pipeline and win rate data can show whether the company is actually built to capture it. That combined view is much stronger than either one alone.
How it helps with fundraising and investment cases
Fundraising decks often include market slides, but many are not investment-grade. They look large, but they are hard to defend under questioning. I have sat in meetings where one investor question about segment logic forced a founder to back away from the headline number.
Investors trust market numbers more when the assumptions connect to sales mechanics.
If I were preparing a company for fundraising, I would want a model that shows not only TAM, SAM, and SOM, but also why the company can win. That means segment fit, pricing logic, growth path, and the commercial capacity to capture share.
For private equity and corporate development work, the same logic supports adjacency mapping, deal screening, and post-acquisition growth planning. A company may look attractive on aggregate, but if its true served market is narrow or saturated, the upside case weakens fast.

Conclusion
I think the best market sizing work is humble, clear, and tied to action. It does not pretend to predict the future with perfect precision. It gives leaders a defensible map of demand, constraints, and likely outcomes. That is enough to make better decisions.
A good market sizing method helps B2B and SaaS teams choose where to play and how to win.
If I had to reduce the whole topic to one lesson, it would be this: start with a clear decision, segment the market in a way that matches your sales reality, compare top-down and bottom-up views, and test every assumption against real evidence. Do that well, and market size stops being a vanity number. It becomes a planning tool.
That shift matters for founders, revenue leaders, strategy teams, and investors alike. It helps with territory focus, pipeline quality, hiring plans, pricing logic, expansion timing, and funding narratives. In other words, it helps teams act with more clarity and less noise.
If you want a sharper view of your addressable market, your reachable revenue pool, or the assumptions behind your growth plan, get to know ZenitData and see how our market intelligence and revenue analytics work can support your next high-stakes decision.
Frequently asked questions
What is a market sizing methodology?
A market sizing methodology is the structured process used to estimate the size of a market in revenue, customers, units, or demand. I define it as the set of rules, data sources, assumptions, and calculations used to measure how big a market is and how much of it a company can realistically serve. It is the method behind the number, not just the number itself.
How do you calculate market size for SaaS?
I usually calculate SaaS market size by identifying the target account universe, segmenting it by fit and pricing tier, and then estimating annual contract value, seat counts, or usage levels for each segment. From there, I apply realistic adoption or penetration assumptions. A top-down view can start from software spend or category estimates, while a bottom-up view starts from actual account counts and likely revenue per account. For SaaS, bottom-up models are often more useful because they reflect ICP, pricing, and go-to-market limits.
Why is market sizing important in B2B?
In B2B, market sizing helps leaders decide which segments to target, how many reps to hire, where to expand, and what growth story is realistic. It also supports fundraising, budgeting, and product planning. I find it especially useful because B2B markets are often narrow, uneven, and affected by long sales cycles. Without a realistic view of demand, B2B teams can overbuild, overspend, or chase poor-fit accounts.
What are common mistakes in market sizing?
The most common mistakes I see are using broad category numbers that do not match the product, confusing TAM with reachable revenue, relying on one average contract value for all segments, double counting accounts, and ignoring internal sales data. Another frequent error is failing to document assumptions clearly. Most market sizing errors come from poor definitions and weak assumption checks, not from math alone.
Which tools help with market sizing analysis?
I use a mix of spreadsheets, BI tools, CRM exports, product analytics, statistics from public institutions, and account-level datasets. For deeper work, techniques such as regression, cohort modeling, scenario planning, and proxy-based estimation can improve the result. In many cases, a well-built spreadsheet with clear assumptions is enough. The best tools for market sizing are the ones that connect external market data with internal revenue evidence.