
I have seen many SaaS teams treat forecasting like a finance exercise that lives in a spreadsheet and nowhere else. That usually ends badly. Sales misses the number, hiring gets ahead of revenue, pricing changes land without a clear view of impact, and leaders lose trust in the plan. In my experience, revenue forecasting for SaaS works only when it reflects how the business really sells, renews, expands, and churns.
SaaS revenue forecasting is the practice of estimating future recurring revenue using historical data, pipeline signals, customer behavior, and market context.
That sounds simple. It is not. But it can become far more useful when I build it around a few hard metrics, choose the right model, and pressure test the result with scenarios.
At Zenit Data, this is where market intelligence and revenue analytics meet. A forecast is not just a finance output. It is a decision tool for founders, CROs, and strategy teams who need to place bets with less guesswork.
Why SaaS forecasts fail
The biggest problem I see is false precision. A model can show revenue down to the euro, while the assumptions under it are weak. If stage conversion rates are stale, churn is blended across very different customer groups, or expansion revenue is treated as automatic, the output looks neat but tells the wrong story.
Bad inputs create confident mistakes.
Another issue is timing. SaaS revenue recognition depends on billing cycles, contract terms, ramp periods, and renewal dates. I once reviewed a forecast that looked healthy until I noticed half the ARR was tied to renewals in one quarter. The company had modeled renewals as smooth monthly inflows. They were not.
That is why I start with historical truth before I touch the forecast. If data hygiene is weak in CRM, billing, and finance systems, I fix that first or at least adjust for known gaps.
The metrics I track first
A good recurring revenue forecast needs a small set of core metrics. I do not start with twenty. I start with the ones that change the story.
ARR and MRR
ARR shows the annual value of recurring contracts, while MRR gives a monthly view that is better for short-cycle tracking and variance checks.
ARR is best for board-level planning and annual targets. MRR helps me spot trend changes faster. If the business sells monthly plans, MRR often tells the cleaner story. If it sells multi-year enterprise contracts, ARR becomes more useful for strategic planning.
The guidance in revenue models and forecasting for SaaS makes this point well. Recurring revenue creates better predictability, but only if contract length, upgrades, and churn are modeled with care.
Churn rate
Gross logo churn and gross revenue churn are not the same thing, and I never mix them. A business may lose few customers but still lose a lot of revenue if larger accounts leave. On the other hand, small account churn can look ugly in logo terms while revenue stays resilient.
I prefer to segment churn by plan, region, acquisition channel, and customer age. Early-stage accounts often behave very differently from mature accounts. If I blend them together, I hide risk.
LTV and CAC
LTV and CAC help me test whether forecasted growth is healthy, not just possible.
LTV depends heavily on retention and gross margin assumptions. CAC depends on what I include in sales and marketing spend. If definitions change by quarter, trend analysis breaks. For B2B SaaS, I want one documented method and I want everyone to use it.
For teams that need a cleaner finance lens, I often point to these SaaS metrics for CFO decision-making because they connect recurring revenue to capital allocation, not just topline growth.
How I choose a forecasting model
There is no single right model for every SaaS company. The best one depends on deal size, sales cycle, pricing structure, data quality, and stage of growth.
Cohort analysis
Cohort forecasting groups customers by start date, segment, or acquisition source and then tracks how revenue behaves over time. I like this approach because it captures the shape of retention and expansion instead of flattening everything into averages.
Its strengths are clear:
-
It shows retention decay and expansion timing by customer group.
-
It helps explain why growth changed, not just how much.
-
It is very useful for pricing reviews and customer success planning.
The downside is data depth. Cohort models need clean historical records and enough time to observe behavior. Newer companies may not have that yet.
Time series models
Time series forecasting uses past revenue patterns to project future results. This can be very effective for stable businesses with enough history and low structural change. I use it to model baseline MRR, seasonality, and renewal trends.
Time series models are strong at pattern recognition, but weak when the business model is changing fast.
If pricing changed, the sales team doubled, or a new market opened, old patterns can mislead. I treat time series as a grounding tool, not the whole answer.
Pipeline-based forecasting
For sales-led SaaS, I often build a pipeline model that starts with opportunity creation, stage progression, conversion rates, average contract value, and sales cycle length. This is where many teams go wrong. They count pipeline value, but they do not score pipeline quality.
I want to know:
-
How much pipeline is sourced from repeatable channels.
-
Whether stage definitions are enforced in CRM.
-
How conversion varies by segment and rep tenure.
-
What share of late-stage deals slipped in prior quarters.
That last one matters a lot. If late-stage deals often slip, I reduce confidence in the quarter close. A neat weighted pipeline can still be too optimistic.
When teams need that level of visibility, I find that sales and marketing metrics tied to funnel quality make forecasting far more grounded.
Scenario planning
Scenario planning is not a separate forecast as much as a disciplined set of alternate futures. I usually build three cases: base, upside, and downside. In some markets, I add a stress case.
Scenario planning turns a single forecast into a decision system.
The value is not just the range. It is the assumptions. If win rates soften by 5 points, or renewal rates drop in one segment, what happens to hiring, cash, and price strategy? That is the conversation leaders need.
How I improve forecast accuracy
Accuracy does not come from making the model more complex. It comes from tightening assumptions and feedback loops.
First, I separate new business, renewals, and expansion. They behave differently, so I model them differently. New business depends on pipeline flow and conversion. Renewals depend on customer health and contract timing. Expansion depends on product usage, account development, and pricing structure.
Second, I adjust for behavior, not just arithmetic. A rep ramping in month two should not be forecast like a top performer in year three. A new geographic market should not inherit conversion rates from a mature region. Behavioral variability matters more than many teams admit.
Third, I bring in external context when it affects demand or renewal risk. In B2B markets, budget pressure, buying committee delays, and sector shifts change close timing. This is where a broader market intelligence approach helps keep the model tied to reality.
Why spreadsheets stop working
I still use spreadsheets for quick tests. I do not trust them as the operating system for a scaling forecast. Version control breaks, formulas drift, and definitions get changed quietly. Then one board pack says one thing and the sales review says another. I have seen that happen more than once.
As SaaS teams grow, forecasting should move from manual sheets to connected analytics and automation.
That does not mean adding software for its own sake. It means connecting CRM, billing, finance, and customer data so the forecast refreshes from the same base truth. A structured revenue analytics setup makes that process less fragile and much easier to audit.

How forecasting shapes pricing, growth, and planning
A forecast is not just for reporting. I use it to test strategy. If a price increase lifts ARR but raises churn in one segment, I want that tradeoff visible before rollout. If expansion revenue is carrying the plan, customer success headcount may need to rise before sales hiring does.
Resource planning also gets better when the forecast is segmented. Marketing spend can be aligned to payback windows. Hiring can follow realistic ramp assumptions. Finance can model cash with fewer surprises. For executive teams, this is where the forecast becomes a working tool instead of a monthly ritual.
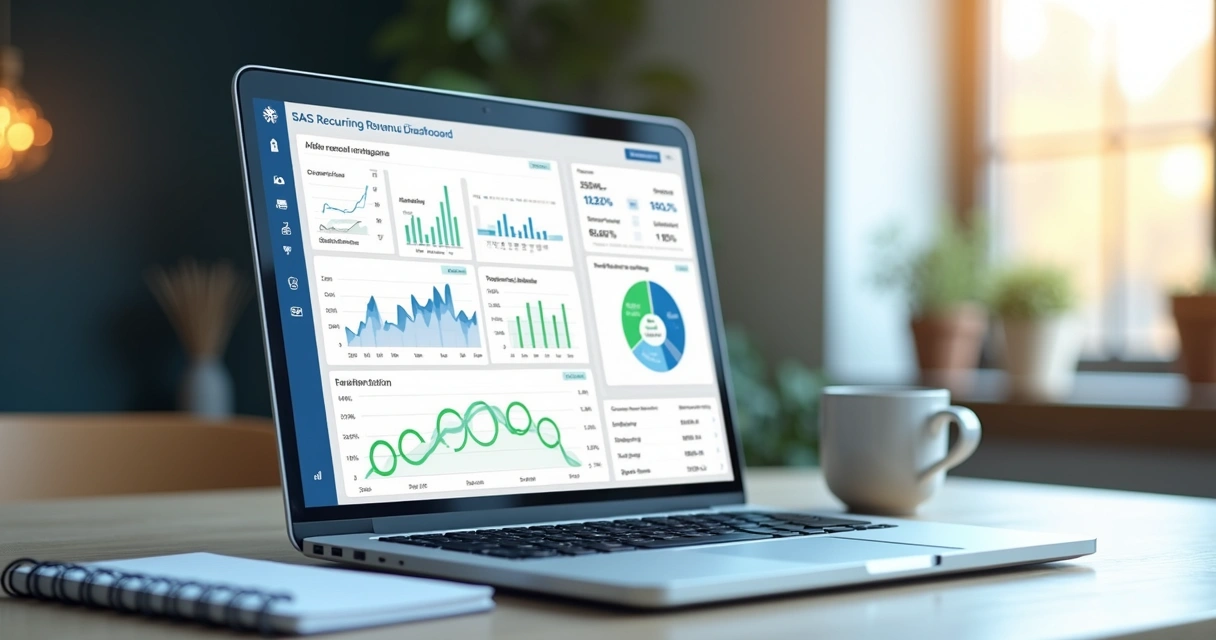
I also like using visual tracking for stakeholder trust. A clean benchmark view such as the SaaS revenue dashboard helps teams see whether changes in bookings, retention, or expansion are moving in line with plan.
Common mistakes I keep seeing
Some mistakes repeat across almost every SaaS category. I try to catch them early.
-
Using one average churn rate across all customers.
-
Treating pipeline coverage as proof of future revenue.
-
Ignoring seasonality in enterprise buying cycles.
-
Counting expansions without a clear trigger model.
-
Failing to update assumptions after pricing or GTM changes.
One more stands out. Teams often forecast bookings well but fail to map bookings into recognized recurring revenue with proper timing. That creates confusion between sales performance and financial reporting. They are linked, but they are not the same thing.
Advanced tips for scaling teams
When a company moves from early traction to scale, I think the forecast should mature in stages.
Start by locking metric definitions. Then segment the forecast by motion, region, and customer type. After that, add variance reviews every month. I like to ask three simple questions: what changed, why did it change, and which assumption now looks weak?
For B2B decision-makers, I also suggest assigning owners by forecast layer. Sales owns pipeline realism. Customer success owns renewal risk signals. Finance owns model integrity. Strategy owns scenario pressure tests. Shared ownership creates healthier debate.
Alignment beats certainty.
That sentence may sound plain, but I believe it. A forecast will never be perfect. It only needs to be honest, current, and useful enough to support better decisions.
Conclusion
I think the best SaaS forecasting process is the one that helps leaders act early, not the one that looks smartest in a spreadsheet. Strong forecasts combine ARR and MRR tracking, segmented churn, grounded LTV and CAC logic, and the right model for the business stage. They also reflect pipeline quality, customer behavior, and market conditions instead of pretending revenue moves in straight lines.
Good forecasting supports better pricing, steadier growth, and clearer resource planning across the whole SaaS business.
If you want a forecast that your finance, sales, and strategy teams can actually trust, get closer to the data structure behind it. That is exactly where Zenit Data can help, through market intelligence, senior-level revenue analytics, and tools built for high-stakes B2B planning. If you want to know us better, start by looking at how your current forecast is built and where a sharper operating view could change the next decision.

Frequently asked questions
What is SaaS revenue forecasting?
SaaS revenue forecasting is the process of estimating future recurring revenue from subscriptions, renewals, expansions, and new sales. I build it using metrics like MRR, ARR, churn, CAC, and LTV, then adjust for pipeline quality, contract timing, and market conditions.
How do I choose a forecasting model?
I choose the model based on the business design and data maturity. Cohort models work well when retention and expansion patterns are visible by segment. Time series works better when revenue history is stable. Pipeline-based models fit sales-led SaaS, and scenario planning helps when uncertainty is high.
What metrics are key for SaaS forecasts?
The main metrics I watch are ARR, MRR, churn rate, LTV, and CAC. I also track win rate, sales cycle length, expansion rate, renewal timing, and pipeline coverage by stage. Together, they show both revenue potential and revenue risk.
How can scenario planning help SaaS revenue?
Scenario planning helps by showing how revenue changes under different assumptions, such as lower win rates, higher churn, or stronger expansion. I use it to test hiring plans, pricing moves, and budget choices before the quarter forces a reaction.
What tools work best for SaaS forecasting?
The best tools are the ones that connect CRM, billing, and finance data into one reporting flow. I still use spreadsheets for quick checks, but scaling SaaS teams usually need automated analytics, shared definitions, and live dashboards to keep forecasts accurate and aligned across functions.