

Market sizing is often treated as a technical exercise. Define Total Addressable Market (TAM), narrow it to Serviceable Addressable Market (SAM), estimate Serviceable Obtainable Market (SOM), multiply by price, and produce a revenue opportunity figure. The spreadsheet appears coherent. The numbers look defensible. Strategic decisions move forward.
In practice, market sizing frequently fails in SaaS companies not because of flawed arithmetic, but because of structural modeling errors embedded in segmentation, competitive assumptions, data quality and adoption velocity. The formulas are rarely the problem. The construction logic is.
Understanding why market sizing fails requires examining how TAM, SAM and SOM are operationalized under real commercial constraints rather than theoretical abstractions.
What Market Sizing Actually Measures
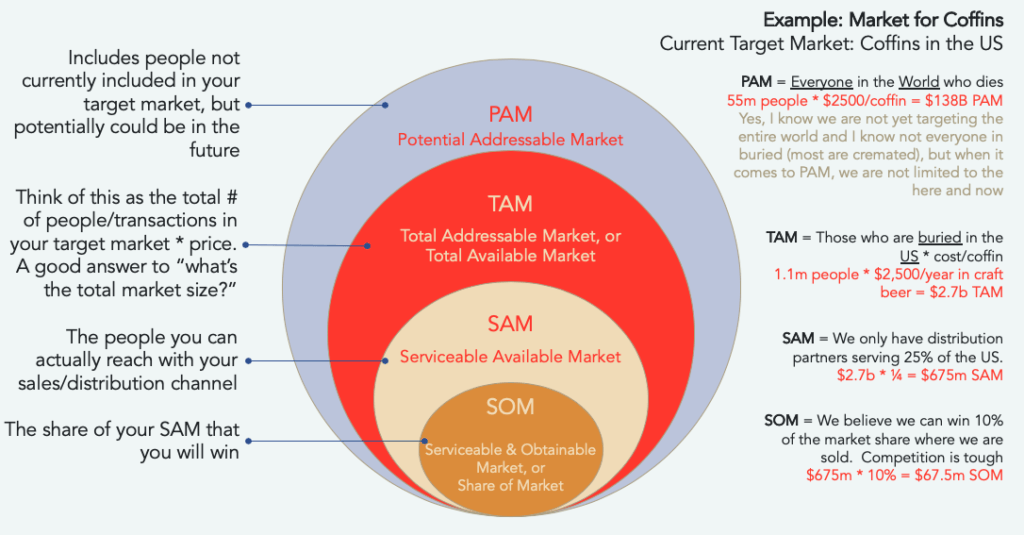
Market sizing estimates potential demand within a defined boundary and time horizon. In venture and strategy contexts, TAM represents the total theoretical demand for a product category, SAM reflects the portion aligned with the company’s solution and geographic reach, and SOM represents the realistically capturable share over a defined period.
These definitions are widely referenced across venture capital material, consulting frameworks and startup advisory literature. However, clarity at the definitional level does not guarantee structural robustness at the modeling level.
In SaaS environments, especially B2B, accessibility is not proportional to market size. It is constrained by switching costs, budget cycles, procurement structures and competitive saturation. A model that treats TAM as linear opportunity will systematically overestimate growth capacity.
Why Top-Down Market Sizing Fails in SaaS
The top-down approach begins with macro industry data. A company might reference global software spending estimates from firms such as Gartner or IDC, filter by geography, restrict by company size and conclude with a narrowed TAM number that appears data-backed.
The structural weakness lies in conflating industry revenue with accessible opportunity. Industry revenue aggregates services, bundled contracts, legacy systems and spending categories that may not be realistically contestable. Macro growth rates do not translate into equal expansion probability for new entrants.
In enterprise SaaS, procurement cycles can exceed twelve months. Multi-year contracts reduce near-term switching probability. Vendor lock-in and integration complexity introduce friction not visible in macro datasets. Top-down models generally omit these variables.
The result is a TAM figure that is mathematically coherent but operationally inflated.
Why Bottom-Up Market Sizing Also Fails
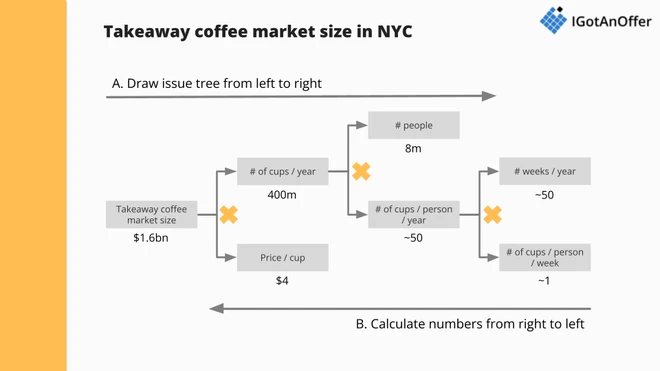
Bottom-up models attempt to improve realism by starting with account-level logic. A typical SaaS calculation multiplies the number of potential accounts by an assumed Average Contract Value (ACV). This approach appears more grounded because it references identifiable entities.
However, bottom-up models introduce different structural distortions. Account universes are often derived from incomplete or over-inclusive datasets. Public registries and business databases frequently include inactive entities, subsidiaries without budget authority or companies that do not match true Ideal Customer Profile (ICP) criteria.
ACV assumptions are also frequently static. In reality, contract values vary significantly across sub-segments, geographies and maturity levels. Averages hide dispersion. If ACV assumptions are not segmented properly, revenue projections skew upward.
Most importantly, bottom-up models often ignore adoption velocity. Even if 8,000 accounts technically match ICP criteria, realistic capture rates depend on sales capacity, brand credibility, channel strategy and competitive density. Without modeling penetration speed over time, bottom-up TAM estimates overstate practical revenue capture.
The Segmentation Error at the Core of TAM Mistakes
The most common structural cause of TAM, SAM and SOM errors in SaaS is weak segmentation design. Many companies segment markets using industry vertical, employee count and geography. These variables are convenient but insufficient.
Software adoption behavior depends on digital maturity, integration readiness, budget ownership structures, regulatory exposure and internal change capacity. Two companies with identical revenue bands in the same industry may exhibit completely different purchase probabilities.
Research on innovation diffusion, particularly Everett Rogers’ framework on adoption categories, emphasizes that compatibility, perceived advantage and complexity significantly influence adoption timing. Most TAM models ignore these behavioral variables.
When segmentation is demographic rather than behavioral, market sizing inflates opportunity by assuming uniform adoption probability within segments that are heterogeneous in practice.
Crazy and easy example below, from mymarketresearchmethods.com
Competitive Saturation and Switching Friction
Another overlooked dimension in SaaS market sizing is competitive penetration. If a majority of target accounts already use a competing solution under multi-year contracts, immediate accessibility declines dramatically. Enterprise software replacement cycles often span several years, particularly in regulated industries.
A structurally sound market sizing model must incorporate competitive density, contract duration patterns and switching barriers. Ignoring these factors produces a theoretical SAM that does not translate into near-term SOM.
The distinction between theoretical eligibility and operational accessibility is critical. TAM models frequently measure eligibility. Revenue models require accessibility.
Geographic Distortion in Expansion Models
SaaS companies expanding internationally often reuse segmentation assumptions from their home markets. This introduces geographic distortion. Regulatory frameworks such as GDPR in the European Union, procurement centralization differences and SME digital adoption variability materially affect conversion probability.
OECD and European Commission digital adoption reports demonstrate significant variation across countries in enterprise software uptake. Applying uniform adoption ratios across regions leads to inflated international TAM projections.
Market sizing in SaaS must therefore integrate localized behavioral data rather than extrapolate from aggregate global figures.
Time Horizon and Capital Environment Effects
TAM is frequently presented as a static number. In reality, market accessibility fluctuates with macroeconomic conditions, capital availability and budget elasticity. During capital tightening cycles, discretionary software purchases decline and expansion revenue slows. Public SaaS earnings disclosures over the past years show contraction in expansion velocity during downturns despite stable theoretical TAM.
A structurally robust market sizing model must embed time horizon assumptions and sensitivity scenarios. Without modeling economic cyclicality, TAM becomes detached from revenue planning.
Data Quality and Entity Verification
One of the least discussed reasons why market sizing fails is entity verification. Public business databases often contain duplicates, holding entities, dissolved companies and subsidiaries without independent procurement authority. Counting these entities as addressable accounts inflates bottom-up TAM.
Data-driven TAM modeling requires verified active entities, revenue band filtering, ownership clarity and, where relevant, technology stack validation. Without entity-level verification, even bottom-up models remain speculative.

Stress-Testing a SaaS Market Size Model
Before treating TAM, SAM and SOM as strategic anchors, SaaS companies should validate how many verified companies truly match ICP criteria today, what proportion already use competing solutions, what realistic sales capacity exists per territory and what portion of accounts have aligned budget authority.
If these variables cannot be grounded in empirical data, market sizing remains narrative rather than intelligence.
Why Market Sizing Fails in Practice
Market sizing in SaaS fails when segmentation ignores behavioral variables, competitive saturation is excluded, switching costs are unmodeled, ACV assumptions remain static, geographic heterogeneity is flattened and entity data is unverified. None of these are arithmetic mistakes. They are structural modeling errors.
When TAM becomes a fundraising narrative rather than an operational planning tool, misalignment between projected opportunity and realized revenue becomes inevitable.
Toward Data-Backed Market Sizing in SaaS
Validating market size in SaaS requires shifting from industry-level revenue abstractions to entity-based modeling. Instead of asking how large an industry is, companies should determine how many verified entities match their real ICP, how many are contractually accessible within defined time horizons and how sales capacity interacts with adoption friction.
Data-backed market sizing integrates competitive penetration mapping, realistic conversion assumptions and time-based sensitivity analysis. When TAM, SAM and SOM are constructed on verified entity data and behavioral segmentation rather than macro aggregates, market sizing becomes a strategic instrument rather than a presentation artifact.

Frequently Asked Questions (FAQ)
Why does market sizing fail in SaaS companies?
Market sizing fails in SaaS when TAM models rely on macro industry revenue instead of verified entity-level data, ignore competitive penetration, assume uniform adoption rates within segments and fail to model switching costs and procurement cycles.
Is top-down or bottom-up market sizing more accurate?
Bottom-up market sizing is generally more precise because it starts with identifiable accounts and contract values. However, it still fails if the account universe is inaccurate, ACV assumptions are static or adoption velocity is unrealistic. Top-down models are useful for context but weak for operational planning.
What are the most common TAM mistakes?
Common TAM mistakes include overestimating accessible demand, using industry revenue as a proxy for software budget, ignoring competitive saturation, flattening geographic differences and assuming immediate market penetration.
How do you validate TAM in SaaS?
Validating TAM requires verified company-level data, realistic ICP filtering, competitive penetration analysis, renewal cycle modeling and sensitivity testing over defined time horizons. Market sizing must reflect accessibility, not theoretical demand.
What is the difference between TAM, SAM and SOM?
TAM represents total theoretical demand for a category. SAM reflects the portion aligned with your solution and reach. SOM represents the realistically capturable share over a specific period, considering competition and execution constraints.
Why is competitive density important in market sizing?
If a high percentage of your target accounts already use competing software under long-term contracts, your near-term SOM is constrained. Competitive saturation directly reduces accessible demand even when TAM remains large.
How does geography affect SaaS market sizing?
Regulatory environments, procurement structures, digital maturity and SME adoption rates vary significantly by region. Applying uniform adoption assumptions across geographies inflates TAM and distorts expansion forecasts.
Can a large TAM still lead to failure?
Yes. A large TAM does not guarantee accessible demand. Companies frequently fail because their SAM and SOM assumptions are unrealistic, even when industry-level TAM appears substantial.
How often should TAM be updated?
TAM should be reviewed annually or when major changes occur in pricing strategy, ICP definition, competitive landscape, regulatory frameworks or macroeconomic conditions.
What data sources improve market sizing accuracy?
Reliable sources include OECD digital adoption data, European Commission SME reports, Gartner industry spending estimates, public SaaS earnings disclosures, verified business registries and entity-level commercial databases.
How do switching costs affect market size?
Switching costs delay conversion even when theoretical demand exists. Enterprise SaaS replacement cycles often exceed several years, which reduces realistic short-term SOM.
Is market sizing different for B2B vs B2C SaaS?
Yes. B2B SaaS market sizing must account for procurement cycles, contract structures, compliance requirements and multi-stakeholder buying processes. B2C models are more volume-driven and less contract-constrained.
References
Below are institutional and research sources supporting the structural arguments made in the article.
Gartner. “Forecast: Enterprise Software Spending.”
https://www.gartner.com/en/research/methodologies/forecast
IDC. “Worldwide Software and Public Cloud Services Forecast.”
https://www.idc.com
OECD. “ICT Access and Usage by Businesses.”
https://data.oecd.org/ict/ict-access-and-usage-by-businesses.htm
European Commission. “Digital Economy and Society Index (DESI).”
https://digital-strategy.ec.europa.eu/en/policies/desi
McKinsey & Company. “Technology Trends Outlook.”
https://www.mckinsey.com/capabilities/mckinsey-digital/our-insights/technology-trends-outlook
Rogers, Everett. Diffusion of Innovations (theoretical framework reference).
https://books.google.com/books/about/Diffusion_of_Innovations.html
Statista. “Enterprise Software Market Revenue.”
https://www.statista.com/topics/1647/enterprise-software/
Sequoia Capital. “Market Size and TAM Guidance for Startups.”
https://www.sequoiacap.com/article/writing-a-business-plan/
Y Combinator. “How to Calculate TAM.”
https://www.ycombinator.com/library/6i-how-to-calculate-tam
OECD. “SME and Entrepreneurship Outlook.”
https://www.oecd.org/industry/smes/
European Central Bank. “Corporate Financing Conditions in the Euro Area.”
https://www.ecb.europa.eu/pub/economic-bulletin
Public SaaS Earnings Reports (example: Salesforce Investor Relations).
https://investor.salesforce.com